Bajaj Auto Ltd. Results : Q3 / FY16
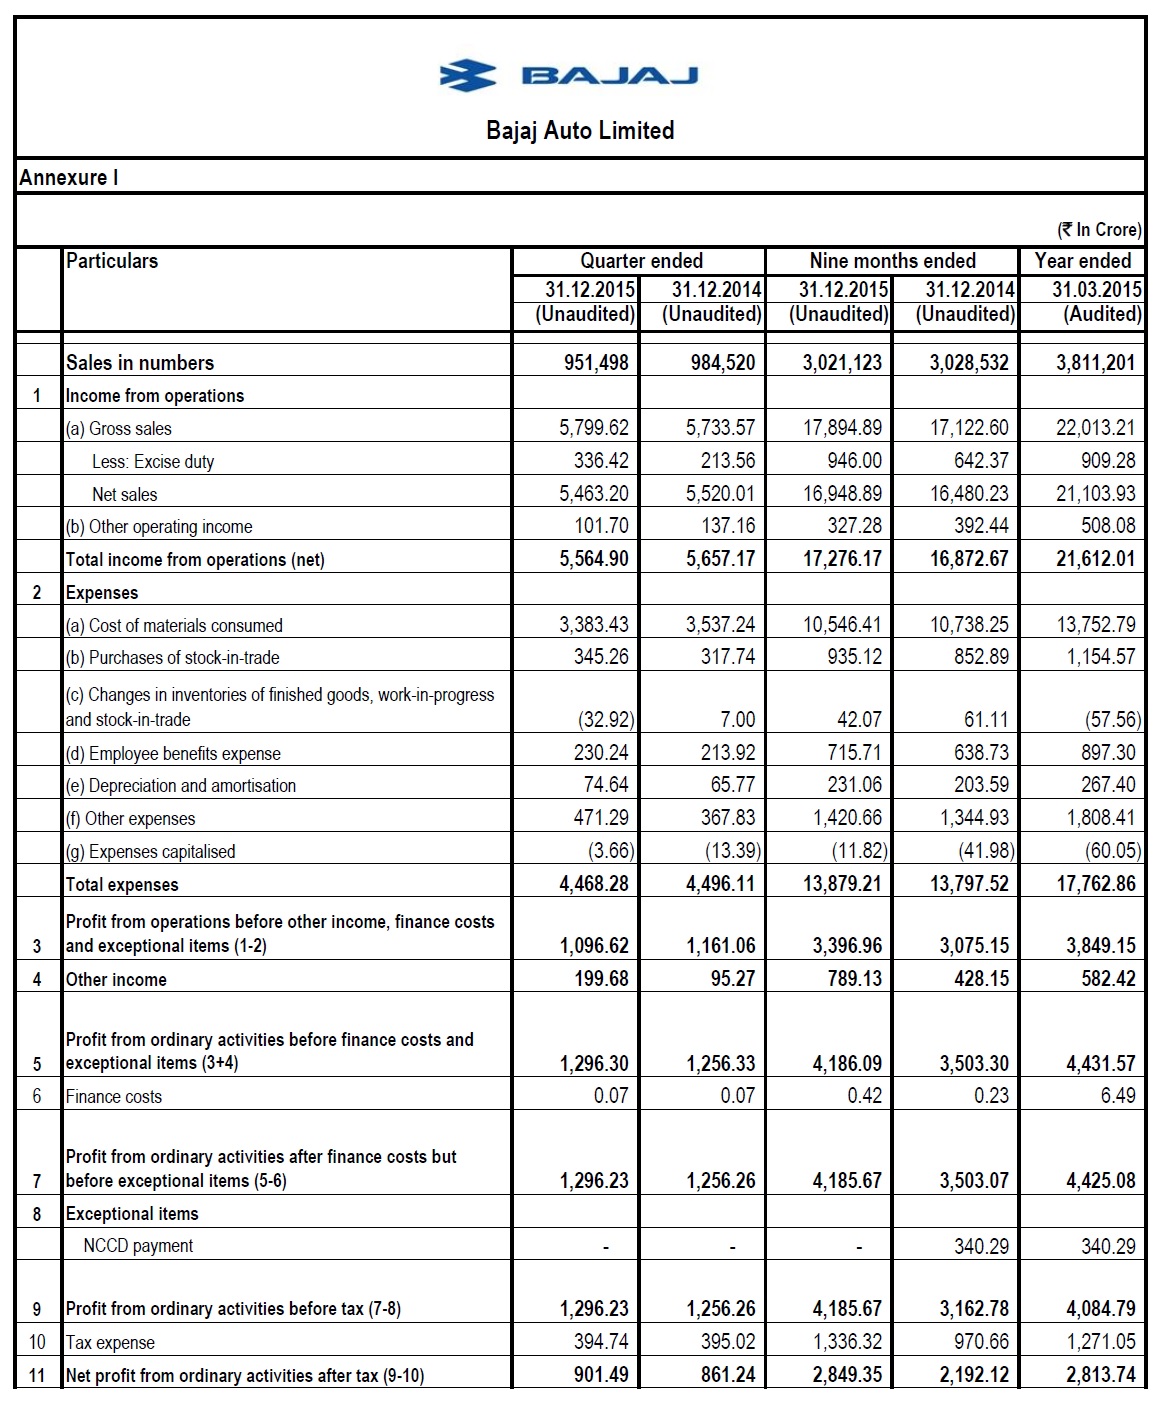
Turnover – ` 5,765 crore; Profit after tax – ` 901 crore
EBITDA margin – 22%
A meeting of the Board of Directors of Bajaj Auto Limited was held today to consider and approve the results for Q3 / FY16.
In a challenging domestic market and a volatile global scenario Bajaj Auto recorded an industry best operating EBITDA margin of 22.0% For the quarter, Profit after tax again crosses ` 900 crore
Profit after tax of ` 2,849 crore earned during 9M ending 31st December 2015 exceeds the profit after tax earned by the company in the full year of FY15
1. Key highlights
The sterling performance is a result of a seamless execution of the company’s business strategy. a. Motorcycle ( domestic )
The strategy to expand the “ Price ” segment and to reinforce the company’s leadership in the “ Premium ” and “ Luxury ” segment has paid rich dividends
- “ Price ” segment
- The introduction of Platina ES and CT at the beginning of the year expanded this segment by ~350 bps In fact, the entire growth in this segment was led by Bajaj Auto Market share of the company in this segment increased to ~34% in Q3 / FY16 from ~23% in FY15 Recorded a sale of 215,000 units in Q3 / FY16 – growth of 86% over Q3 / FY15 With the introduction of CT100-B motorcycle model in January 2016, company expects to further gain in market share
- “ Premium ” and “ Luxury ” segment
- Volumes of the newly launched highly profitable Avenger series recorded an increase from an average of 3,500 units per month to over 20,000 units in December 2015 !!!
Given the strong demand for Avenger, company plans to increase the production capacity to 30,000 units per month by March 2016
- The new Avengers, along with Pulsars, reinforced the company’s leadership position – in the “ Premium ” segment, market share improved to over 50% in Q3 / FY16 from 43% in FY15
- Here again, growth in the “ Premium ” segment was led by BAL. The Avengers, along with the Pulsars, recorded a growth of ~11% as against an industry growth of ~3% over Q3 / FY15
- In the “ Luxury ” segment, the addition of Pulsar RS200 increased the company’s market share to ~60% in Q3 / FY16 from 40% in FY15
The broad segments covered above represent ~40% of the total domestic motorcycle market where Bajaj Auto is a leader. In this space Bajaj Auto recorded a growth of 43% over Q3 / FY15 as against an industry growth of 10%
- “ Value ” segment
- Launch of the “ V ” motorcycle model planned in February 2016. Compared to the current products in this segment, the “ V ” motorcycle is highly differentiated in form and is superior in mileage & performance
- With this new offering, the company expects to change the future of this segment and is confident to become a market leader in this segment too
b. Commercial Vehicle ( domestic )
The strategy to communicate and reinforce the superiority and strength of Bajaj Petrol and Alternate Fuel ( PAF ) RE three-wheelers while offering differentiated packages for the Diesel customers has been very successful
- Share in domestic market, for petrol and alternate fuel passenger carriers improved to 91% in Q3 / FY16 from 88% in FY15
- Market leadership in the small diesel carrier segment with share in domestic market improved to 64% in Q3 / FY16 from 61% in FY15
- Market share in large diesel carrier segment improved to 21% in Q3 / FY16 from 18% in FY15
- Overall, for December 2015, market share stood at 50%
c. International market
- The strategy to expand geographical presence and improve the market share in individual countries has succeeded
- With the oil prices coming down substantially, some markets are facing balance of payment issues resulting in non-availability of US$ for imports. This has impacted the company’s despatches to those markets. Markets affected are primarily Egypt and Nigeria
- However, at retail level the company is performing extremely well in these markets
- In December 2015, recorded retail sales of 60,000 Boxers in Nigeria and improved market share to ~65% Iran, Nigeria, Colombia, Mexico and Peru witnessed an increase in retail market share
2. Cash and cash equivalents As on 31st December 2015, surplus cash and cash equivalents stood at ` 9,430 crore.
Please click below link to view the entire report:


